Bitcoin Risks $72,500 Slide as $82,000 Resistance Caps Recovery
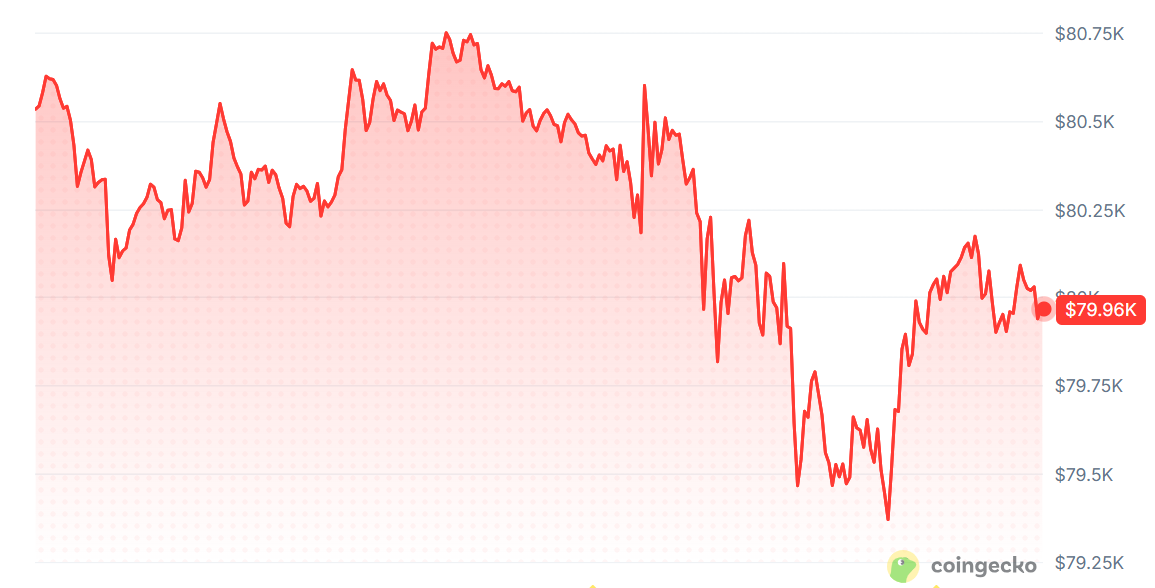
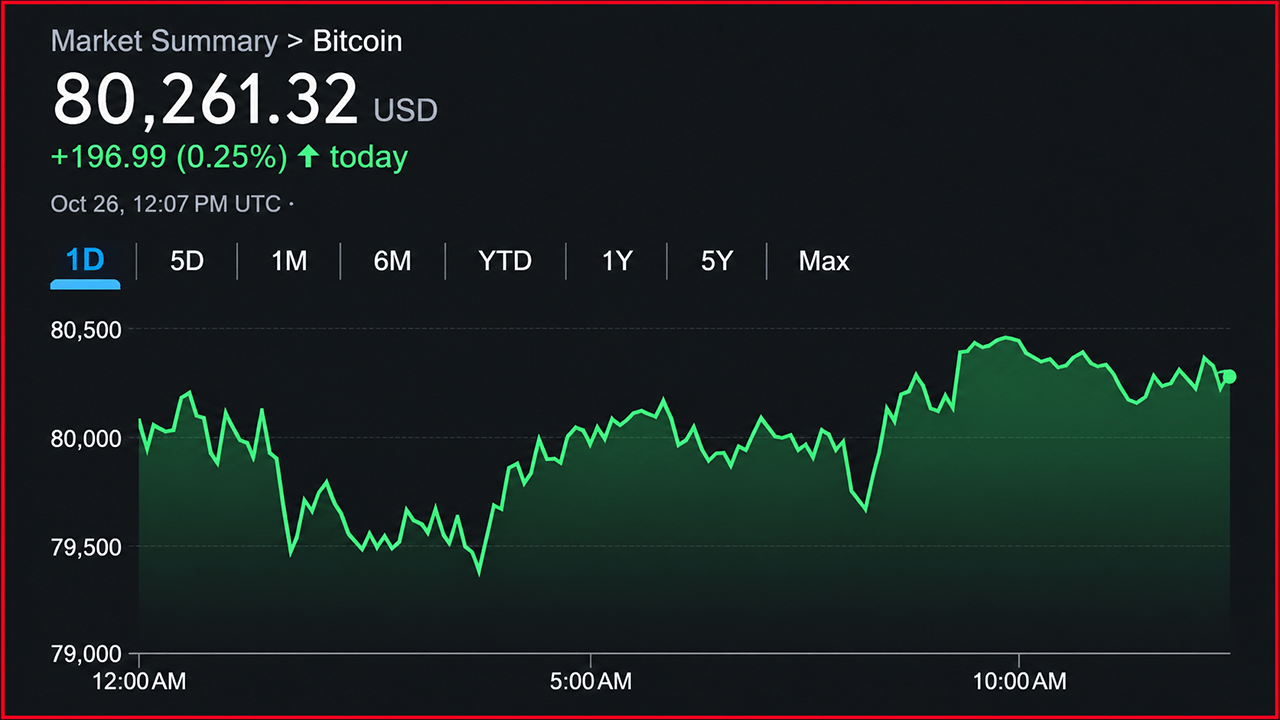
TLDR: Ali Charts flags $72,500 as a potential Bitcoin buying zone while $82,000 remains resistance on his chart. Bitcoin trades at $79,757.25, down 0.74% daily and 3.22% weekly, according to supplied CoinGecko price data. Liquidation heatmaps show overhead clusters near 81,500– 82,000 and downside pockets at 78,500– 79,000. A recovery above $81,000 could pressure shorts, while losing $79,000 would bring lower liquidity into focus. Bitcoin traded at $79,757.25 as analyst Ali Charts identified $72,500 as a potential buying zone following a chart breakdown. CoinGecko data showed Bitcoin fell 0.74% over 24 hours and 3.22% across seven days.
You are reading an excerpt. Blockonomi wrote and owns the full article.
Continue reading at blockonomi.com